



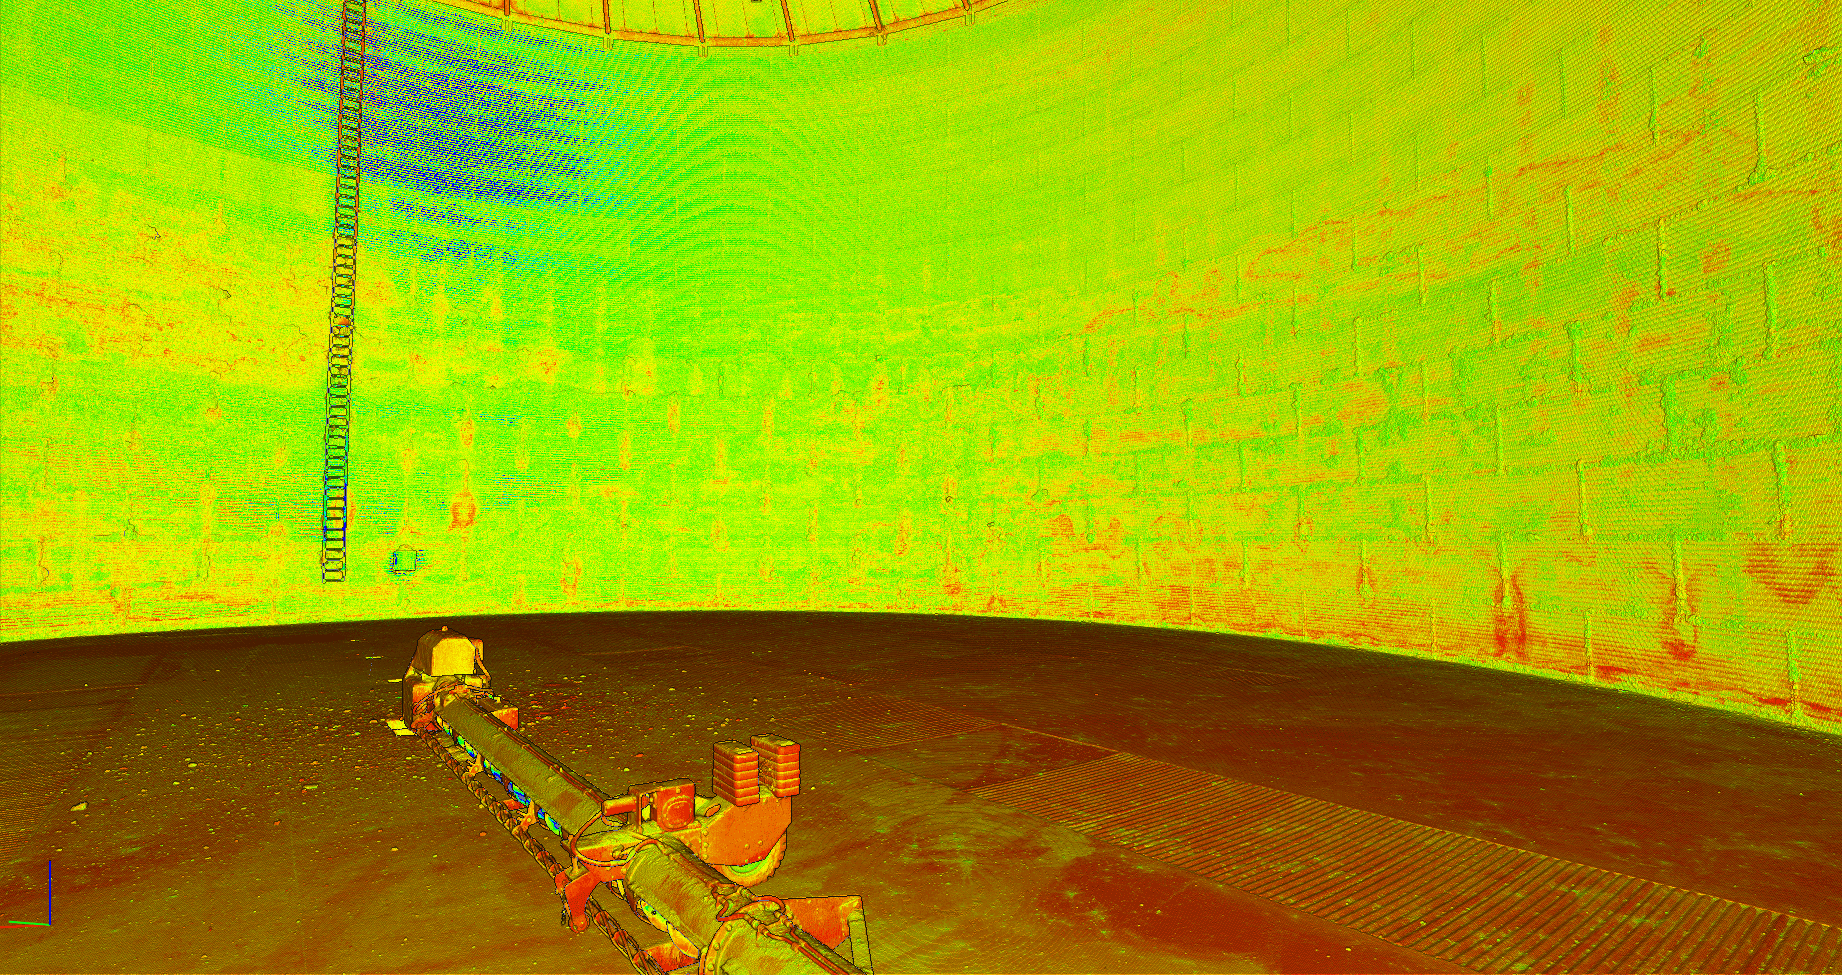
M-LAS: Millimeter-Level
LiDAR Precision
Digital doubles of your bulk storage assets using advanced LiDAR scanning—giving you the data you need without sending anyone inside.
±2mm
Scan Accuracy
Zero
Confined Space Entry
5–7
Business Days
40+
Years Experience
The ChallengeWhat You Can’t See
What You Can’t See
Costs You
Every day, unseen risks threaten your operations. Traditional inspection means sending workers into dangerous, confined spaces—risking lives for incomplete data.
- Costly unplanned outages that halt production
- Safety incidents from confined space entry
- Blind spots causing structural or material issues
- Inaccurate inventory impacting production and finances
Our Process
Precision Data. Zero Risk.
Our 4-stage LiDAR scanning process delivers full asset insights in just 5–7 business days.
1
On-Site Survey
Identify scan points and minimize disruption to your operations.
2
LiDAR Scanning
Capture millions of points with ±2mm accuracy using non-entry methods.
3
Data Processing
Generate detailed point clouds, 360° imagery, and volumetric reports.
4
Digital Delivery
Receive CAD-ready files, PDF reports, and secure offline viewing tools.
Applications
LiDAR Solutions by Industry
Purpose-built scanning programs for the assets and industries where precision matters most.
Application
Kilns & Calciners
Refractory brick condition assessment — fast, accurate, and comprehensive data to drive every shutdown decision.
See Inside Your Asset.
Know the Condition of Every Brick.
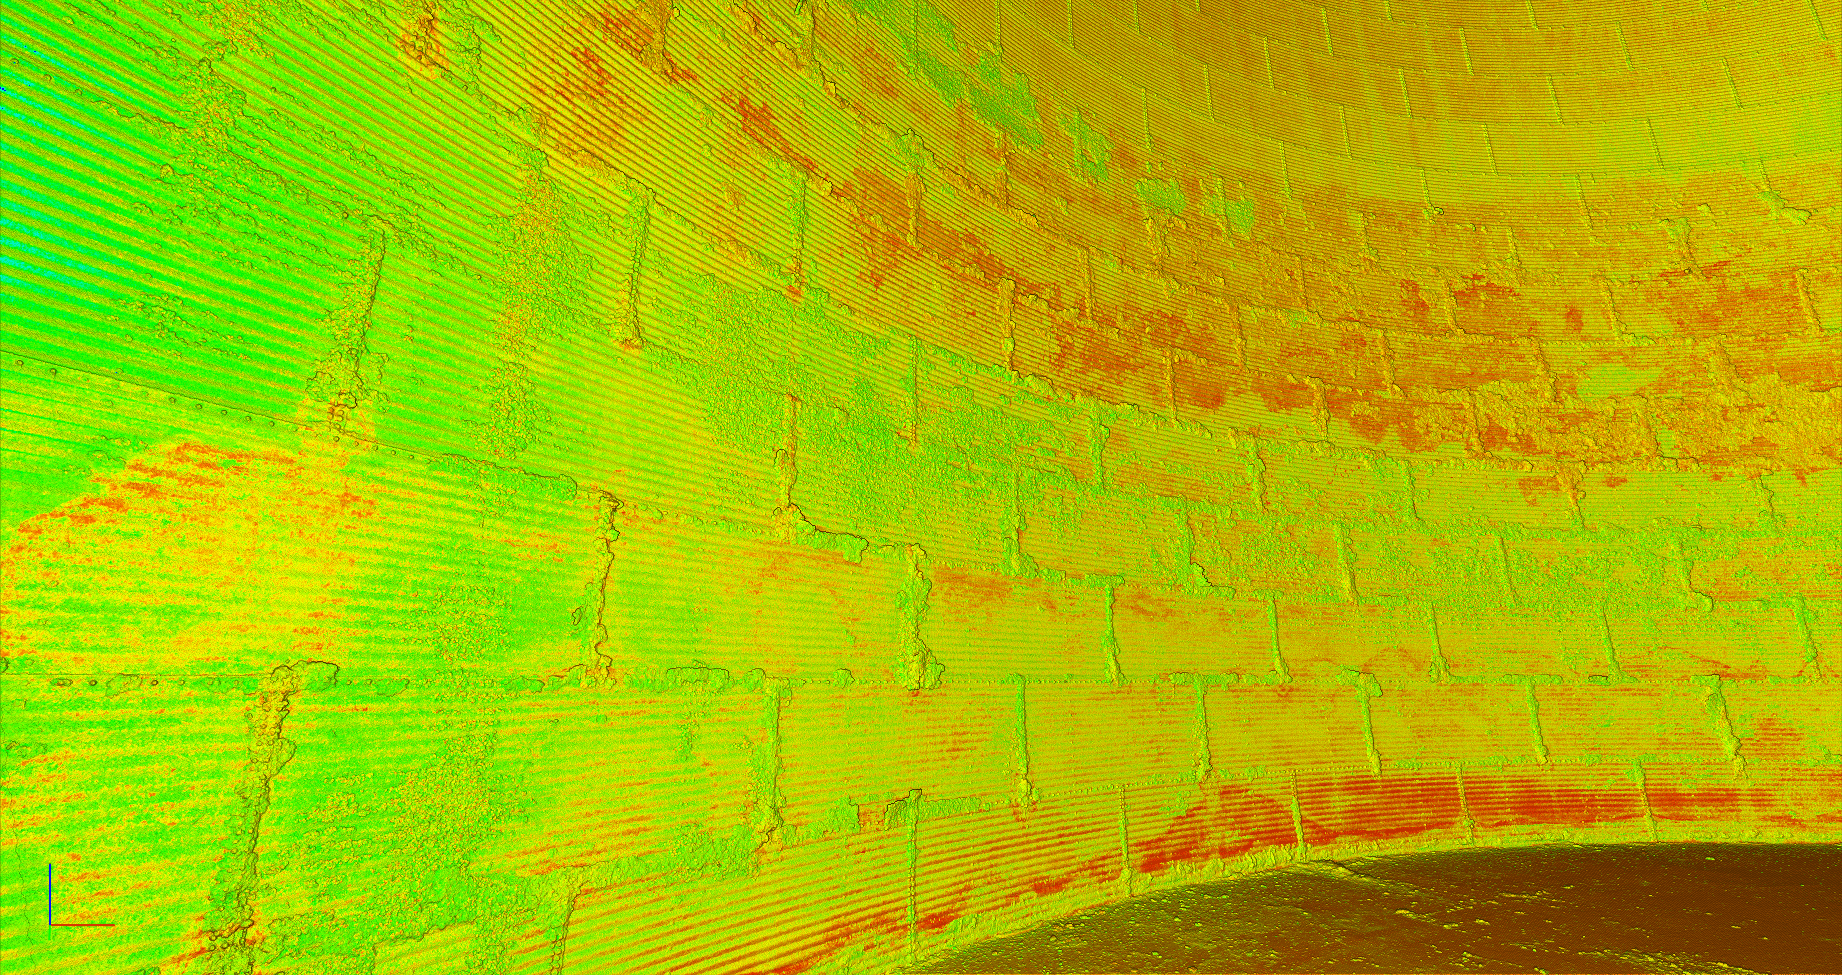
Refractory brick linings in rotary kilns and calciners face extreme thermal, chemical, and mechanical stress. Brick wear is uneven — different zones degrade at different rates. Until recently, assessing lining condition meant sending workers into confined spaces to take manual measurements: slow, hazardous, and producing only a handful of data points across an asset containing thousands of individual bricks.
LiDAR changes this entirely. By emitting millions of laser pulses and measuring their return, our scanners capture the precise three-dimensional geometry of the entire interior surface at ±2mm accuracy.
Key Fact
Traditional manual inspection yields discontinuous spot measurements. Mole•Master M-LAS LiDAR captures millions of data points across the full lining surface — delivering a continuous condition picture no manual method can replicate.

M-LAS Service Coverage
- Full interior surface scan using best-in-class laser scanning technology at ±2mm accuracy
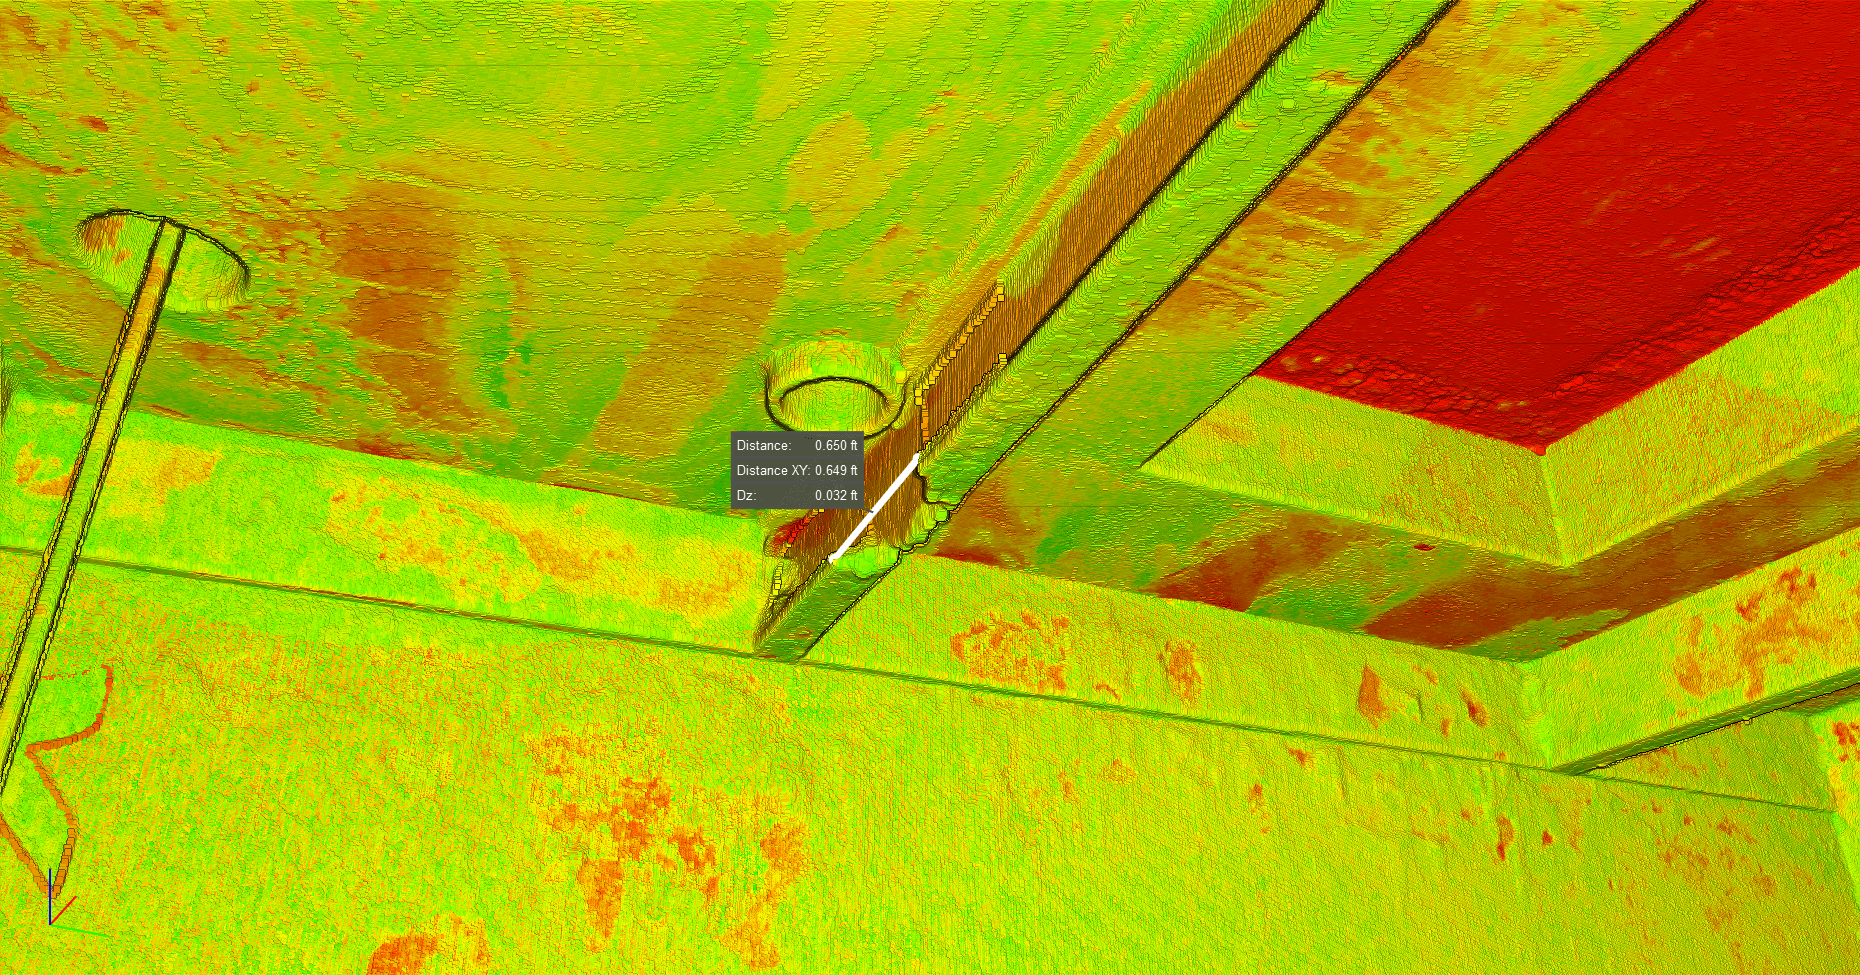
- Detailed 3D point cloud and 360° imagery of the complete lining
- Deviation analysis against original design drawings or baseline scan — highlighting wear, thinning, and damage
- Detection of incrustation build-up, spalling, and structural anomalies across the full lining surface
- CAD-ready files, PDF condition reports, and secure offline viewing tools for your engineering team
Next-Day On-Site Walkthrough
Your Mole•Master technician walks your maintenance, engineering, and operations teams through the scan data on-site — zone by zone — so condition assessments can be made and repair scopes defined before the shutdown window closes.

Impact & Stakeholders
Reduce Shutdown Duration
LiDAR eliminates scaffold setup inside the vessel and can begin once temperatures drop below 120°F — returning condition data far sooner than conventional methods allow.
Eliminate Scope Uncertainty
Avoid costly over-relining and dangerous under-relining. M-LAS data gives a complete picture of every zone so the relining scope reflects actual condition, not conservative assumption.
Avoid Costly Failures
Data-driven maintenance programs built on accurate scanning catch developing problem areas well before they become unplanned production emergencies.

Better-Informed Decisions Across Your Organisation
The value of M-LAS scan data extends beyond the shutdown window. The 3D point clouds, condition reports, and CAD-ready files produced by every scan become a permanent condition record — one that can be interrogated, compared across campaigns, and shared across teams.
Unplanned and poorly scoped shutdowns can run to hundreds of thousands, or millions, of dollars per incident. LiDAR-based assessment directly addresses the root cause: decisions made without accurate data.
How M-LAS Data Informs Better Decisions
Maintenance Teams
Know exactly which zones need intervention and which do not — plan work scope with confidence, not guesswork. Prioritise repair work based on measured lining thickness rather than visual estimate.
Operations & Production
Make go/no-go decisions on campaign extension based on measured remaining lining thickness, not calendar dates. Confirm or revise planned relining scope with hard data in hand.
Engineering
Access CAD-ready point cloud data and deviation reports to validate design assumptions and track wear rates over multiple campaigns. Define where targeted intervention is sufficient versus full reline.
Capital Planning & Finance
Justify refractory expenditure with documented condition evidence. Avoid both over-spending on premature relines and the cost of unplanned failures. Document evidence for insurance or regulatory requirements.
The M-LAS Process for Refractory Brick
Designed to integrate smoothly into your shutdown schedule with minimum disruption to operations. The scan is conducted early in the shutdown window — providing the key data precisely when it makes the difference.

1
Pre-Scan Planning
Our team works with your site contacts ahead of the shutdown to identify optimal scan positions, confirm access requirements, and align the inspection scope with your specific asset geometry and maintenance objectives.
2
On-Site Data Capture
Avoiding entry wherever possible, our technicians capture millions of data points across the full interior surface at ±2mm accuracy — conducted early in the shutdown window when the data matters most.
3
Rapid Data Processing
Point cloud data is processed to generate a full 3D model of the lining. Deviation analysis is run against your design drawings or previous scan baseline to highlight areas of wear, thinning, and anomaly.
4
On-Site Condition Walkthrough
Within 24 hours, your Mole•Master technician walks your teams through the findings — zone by zone, anomaly by anomaly — so repair decisions are confirmed before the shutdown window closes.
Application
Cement Silos
Material buildup and flow-path analysis — fast, accurate, and comprehensive data to support maintenance and operational decisions.
See Every Cubic Foot.
No Confined Space Entry Required.
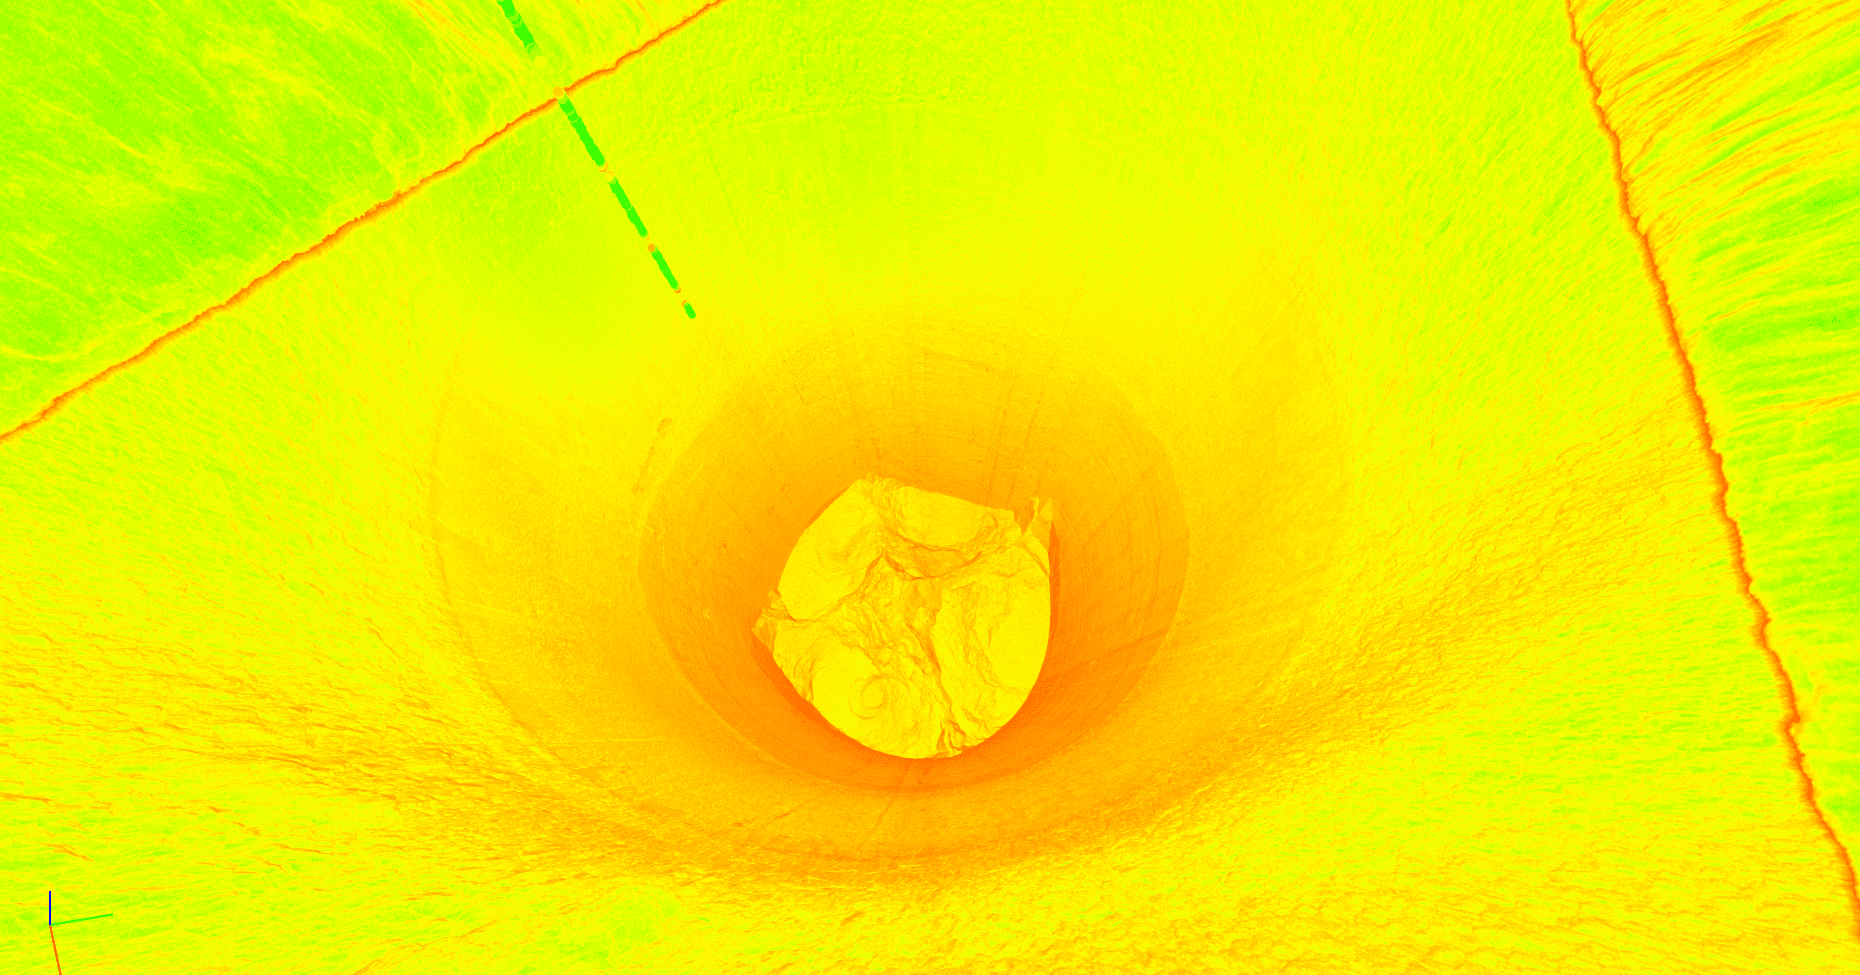
Cement silos are critical storage assets, and every cubic foot of lost capacity can affect production, planning, and revenue. Material buildup, rat-holing, bridging, and hidden obstructions can reduce usable volume and create recurring flow problems that are difficult to diagnose from the outside.
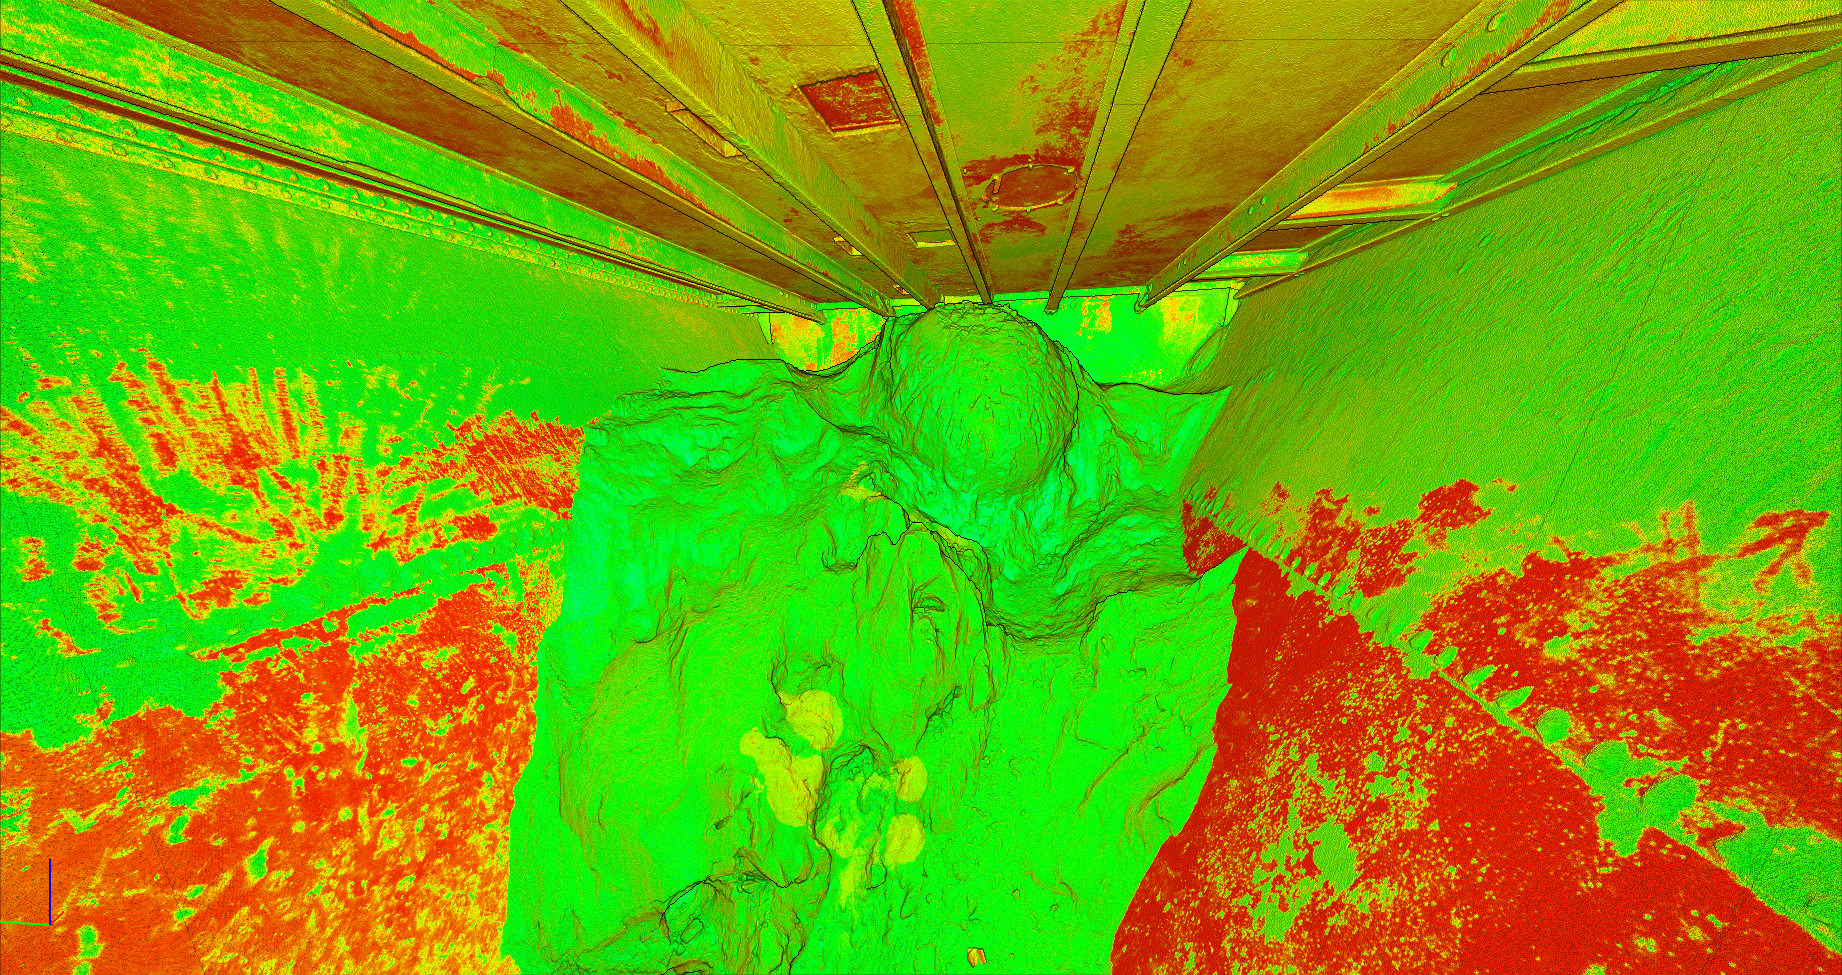
Mole•Master has spent more than 40 years solving material flow challenges in bulk storage assets. With M-LAS LiDAR, we extend that expertise by capturing the precise three-dimensional geometry of the silo interior—without confined space entry—so teams can see exactly where buildup is occurring and how actual conditions compare to the original design intent.
Key Fact
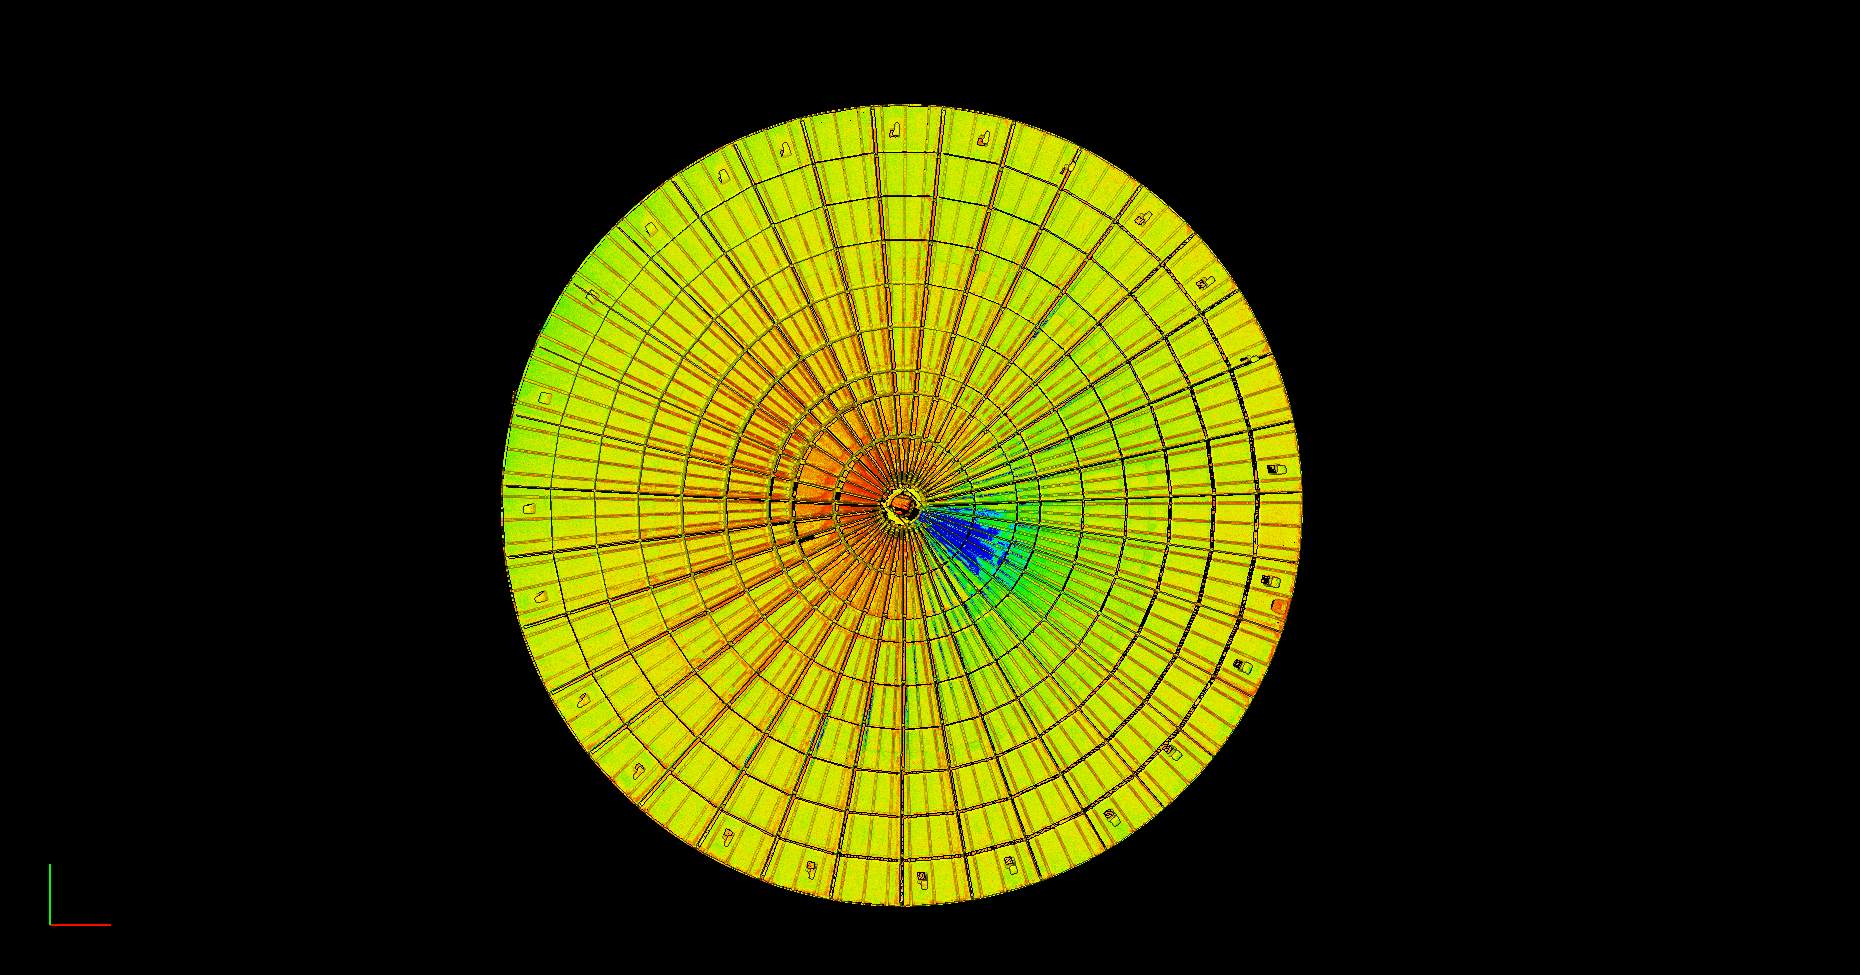
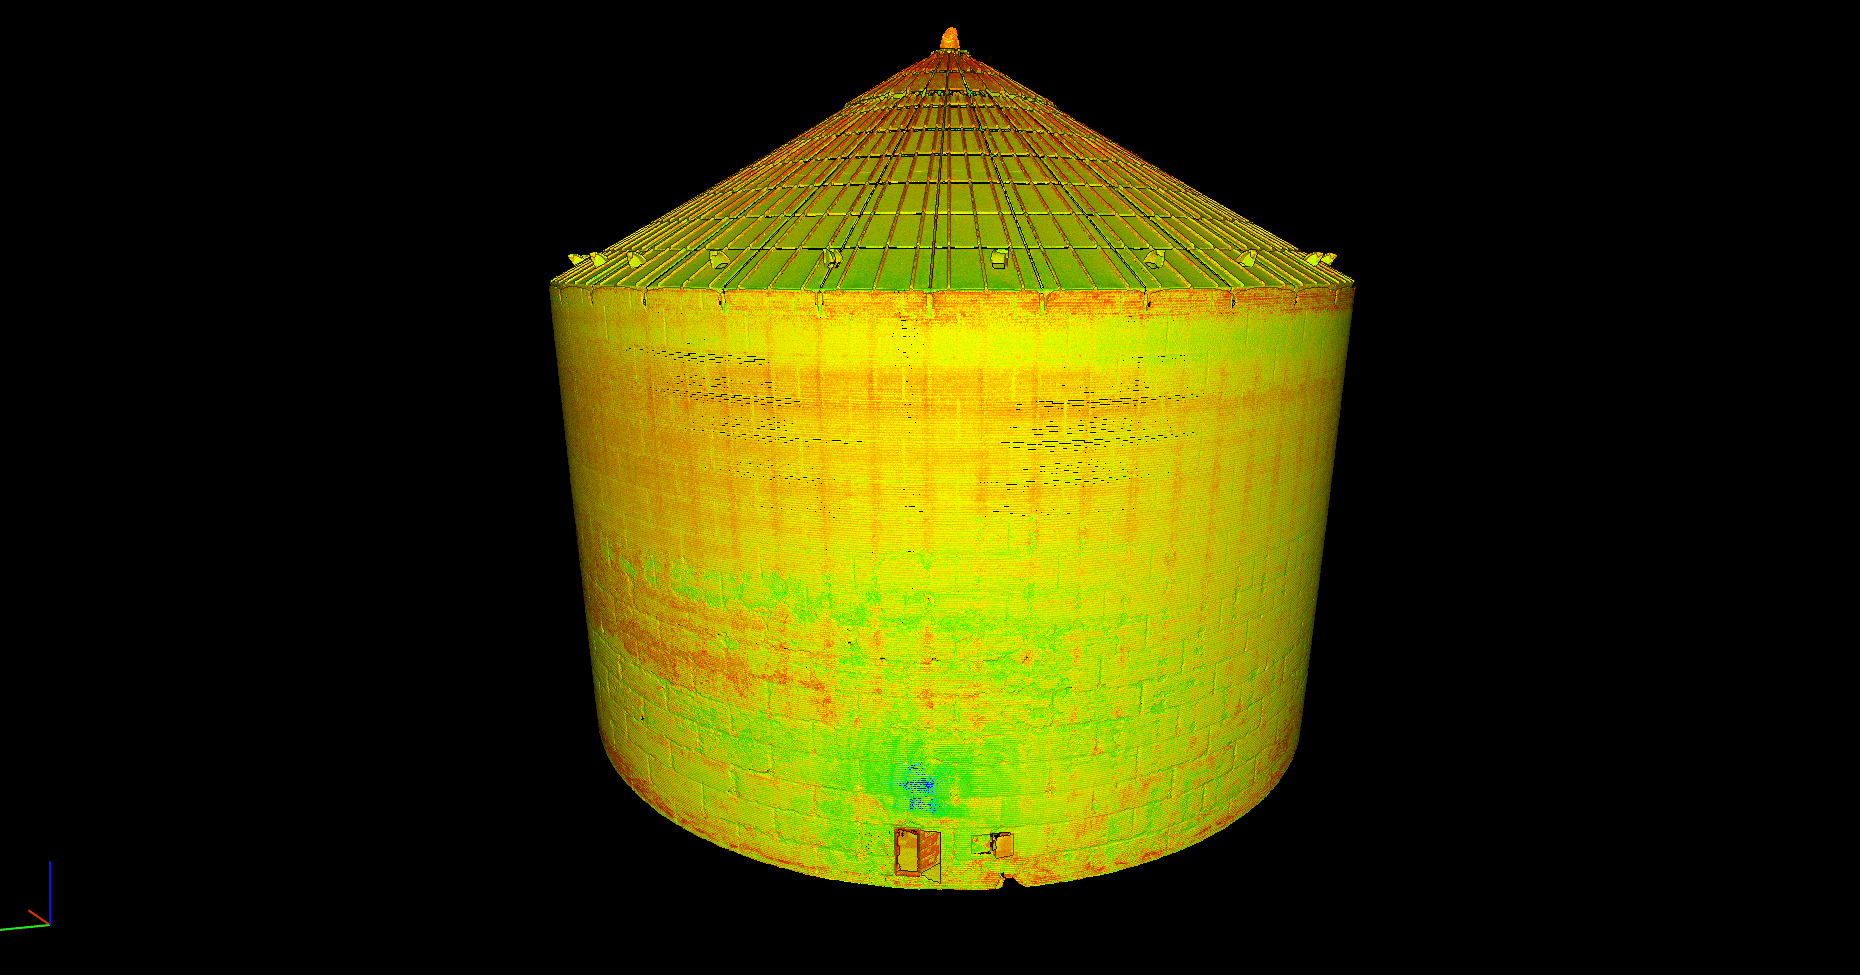
By emitting millions of laser pulses and measuring their return, our scanners capture the interior surface at millimeter-level detail. The result is a complete digital model of the asset that can be used to identify buildup patterns, analyze material flow paths, evaluate internal structures, and compare actual conditions against drawings or CAD models.

Complete Interior Intelligence
- Full interior asset scans before and after cleaning using best-in-class laser scanning technology at ±2 mm accuracy
- Detailed 3D point cloud and 360° imagery of the complete interior surface
- Material flow analysis mapping with comparison to design drawings or CAD models
- Analysis of internal structural components and areas of concern
- CAD-ready files, PDF condition reports, and secure offline viewing tools for your engineering team

Impact & Stakeholders
Safer Visibility Into Internal Conditions
LiDAR scanning gives your team a clear view of the silo interior without requiring confined space entry. Gain accurate, full-asset data that supports safer inspection and maintenance planning.
Root Cause Identification for Flow Problems
Recurring buildup, rat-holing, and flow restrictions often point to deeper issues. Detailed scan data helps teams see where material is accumulating and what internal conditions may be contributing.
Early Detection of Capacity Loss
Even small changes inside a silo can reduce usable volume over time. By identifying hidden obstructions and buildup patterns early, teams can address issues before they lead to serious downtime or costly corrective work.
Better Maintenance Planning
With precise visual data and measurable asset conditions, maintenance teams can plan shutdowns, cleanouts, and repairs with greater confidence and better resource allocation.
Confident Comparison to Design Intent
LiDAR models make it easier to compare current silo conditions to original drawings or CAD files, confirming whether buildup, wear, or internal changes are affecting asset performance.
Designed for Cement Plant Teams
Plant Managers
Plant managers responsible for throughput, availability, and storage performance need reliable information to make timely operational decisions. LiDAR provides a clear understanding of internal conditions and helps plan maintenance that supports production continuity.
Maintenance & Reliability
For teams investigating recurring buildup, restricted flow, or unexpected performance issues, detailed scan data provides a more complete picture than traditional inspection methods and helps prioritize cleanout and reliability efforts.
Engineering Teams
Engineers assessing silo design, retrofit options, or internal obstructions benefit from accurate geometric data that reflects actual field conditions. Outputs can be compared directly with drawings or CAD models.
Operations Teams
Operations personnel need dependable condition data without adding unnecessary risk or disruption. Non-entry LiDAR scanning provides a practical way to understand internal asset conditions while minimizing interference with site activities.
Simple, Proven Workflow
1
Plan the Scan
The process begins by identifying scan locations and reviewing site access, safety requirements, and operational constraints to ensure the scan can be completed efficiently.
2
Capture the Asset Interior
Using non-entry LiDAR technology, the scanner collects millions of data points from the interior surface of the silo, creating a detailed digital record of the asset's geometry.
3
Process and Analyze the Data
Once the field scan is complete, the captured data is processed into a detailed point cloud, imagery set, and analysis model that helps teams interpret current conditions.
4
Deliver Actionable Outputs
Final deliverables include reports, CAD-ready files, and visual models that support maintenance planning and operational decision-making with confidence.
Application
Major Outage Support
Your Outage. Our Team On-Site, Start to Finish - Turning Scan Data Into Decisions in Real Time.
Major outages move fast, and the decisions made in the first hours often shape the entire event. Mole•Master's On-Site LiDAR Outage Support service places a full scanning, imaging, and reporting team directly on your site for the duration of the project - so your team has detailed, accurate condition data available when decisions are being made, not days after the fact.
Why Embed a LiDAR Team On-Site for Your Outage?
Major outages involve dozens of interdependent decisions - scope changes, contractor mobilization, repair prioritization - all made under time pressure and often with incomplete information. Sending scan data off-site for processing and waiting on a report introduces delay at the exact moment speed matters most, and it leaves outage leadership making calls without the people who understand the data in the room.
An embedded on-site team changes this. Our technicians bring a full suite of scanning technology and video imaging capability directly to your facility, capturing and processing condition data throughout the outage - not just once at the start - so new information is available as work progresses and conditions change.
Key Fact
A single scan-and-report cycle gives you a snapshot. An on-site team present for the full outage gives you a running picture - re-scanning zones as work opens them up, tracking progress against plan, and putting current data in front of decision-makers as the outage unfolds.

What the On-Site LiDAR Support Team Delivers
Our On-Site LiDAR Outage Support service is built for the pace and unpredictability of a live outage. For the duration of your project, the service includes:
- A dedicated LiDAR scanning and imaging team on-site for the full outage window, not a single scheduled visit
- A full suite of scanning technology and video imaging equipment to document conditions as they're uncovered
- Continuous data capture across multiple areas and zones as access opens throughout the outage
- On-site data processing, so point clouds, imagery, and condition reports are generated without waiting for off-site turnaround
- Full on-site reporting facilities for the duration of the project, producing updated condition reports and visual documentation as work progresses
- Direct support preparing and presenting scan data for outage meetings, so findings are ready to walk decision-makers through, not just handed off as raw files
- Secure offline viewing tools and CAD-ready outputs for your engineering and planning teams

Real-Time Insight, Right in the Outage Meeting
The most critical differentiator of this service is presence. Rather than scheduling scans around a report deadline, our team is embedded in your outage from the outset, working alongside your maintenance, engineering, and operations groups as the project unfolds.
ON-SITE THROUGHOUT:
Your Mole•Master team is present for daily outage meetings, walking your leadership through the latest scan and imaging data, zone by zone, so scope decisions and repair priorities are made against current conditions - not last week's information.
Having the team on-site for the full duration means your outage leadership can:
- Get updated condition data on newly accessed areas as soon as they're scanned, without waiting for a new inspection to be scheduled
- Walk into daily outage meetings with visuals and reports already prepared and ready to present
- Adjust scope in real time as scan data confirms or revises assumptions made in the outage plan
- Maintain a running visual and data record of the entire outage for post-event review, capital planning, or regulatory documentation
- Reduce reliance on second-hand verbal updates by giving every stakeholder direct access to the same imagery and data
Saving Time and Money During Major Outages
Outages that run long, or that are re-scoped mid-stream without good data, are among the most expensive events a facility can face. An embedded LiDAR support team addresses the underlying problem directly: decisions made without current, accurate information.
Keep Pace With a Moving Outage
Outage scope rarely stays static - new conditions get uncovered once work begins. Because the team and reporting facility are already on-site, newly discovered areas can be scanned and reported on the same day they're accessed, instead of waiting for a follow-up visit to be scheduled and mobilized.
Reduce Meeting-to-Meeting Uncertainty
Outage meetings run more efficiently when the data being discussed is current and already prepared for presentation. Having a team on-site that understands the data and can present it directly removes the lag between "we found something" and "here's what it means for the plan."
Avoid Costly Re-Mobilization
Discovering a scope gap after specialty contractors and equipment have already demobilized is one of the most expensive outcomes in outage management. Continuous on-site scanning throughout the project surfaces issues while the resources needed to address them are still on-site.
Better-Informed Decision Making Across Your Organization
Because the reporting facility operates on-site for the full duration of the outage, the data produced isn't limited to a single deliverable at the end - it accumulates into a complete, day-by-day record of the entire event, available to every team that needs it.
How On-Site LiDAR Support Informs Better Decisions
Outage Leadership
Walk into every outage meeting with current scan data and visuals already prepared - make scope and schedule calls on today's conditions, not last week's.
Maintenance Teams
Get updated condition data on each newly accessed zone as work opens it up, without waiting on a separate inspection visit.
Operation & Production
Track outage progress against plan with visual, measured data - make informed calls on schedule and readiness for restart.
Engineering
Access CAD-ready point cloud data and imagery in near real time to validate repair scopes and design assumptions as the outage progresses.
Capital Planning & Finance
Receive a complete, dated record of conditions and decisions across the outage - useful for cost justification, insurance, and regulatory documentation.
How On-Site LiDAR Outage Support Works
The Mole•Master On-Site LiDAR Outage Support service is built to run alongside your outage schedule from mobilization to completion, adapting as the project evolves.
1
Pre-Outage Planning
Our team works with your outage planners ahead of mobilization to understand the outage schedule, identify priority scan areas, and confirm the access and reporting workflow that will support your outage meeting cadence.
2
Mobilization & On-Site Setup
Our technicians and full scanning and video imaging suite mobilize to your site alongside your outage crews, with a dedicated on-site reporting facility established for the duration of the project.
3
Continuous On-Site Capture & Processing
Throughout the outage, our team scans and images areas as they become accessible, processing data on-site so point clouds, imagery, and condition reports stay current with the state of the project.
4
Ongoing Reporting & Outage Meeting Support
Our team prepares and presents updated findings for your outage meetings throughout the project, giving leadership current, visual data to inform scope, schedule, and repair decisions as the outage progresses.
5
Close-Out Documentation
At the conclusion of the outage, your team receives a complete data package - CAD-ready files, condition reports, and imagery covering the full event - as a permanent record for future planning and comparison.
Plan Your Next Major Outage with an On-Site Data Team
Major outages no longer have to run on a mix of assumptions and delayed reports. Mole•Master's On-Site LiDAR Outage Support puts the scanning technology, imaging capability, and reporting team your outage needs directly on-site for the duration of the project - on-site and on schedule.
Application
Grain & Inventory Management
Precise Volumetric Data. Audit-Ready Inventory, Every Time.
Grain and bulk inventory represent one of the largest line items on any elevator, processor, or terminal’s balance sheet — and one of the hardest to measure accurately. Traditional inventory methods rely on stick readings, weight estimates, and assumptions about pile shape, and those assumptions can leave book inventory and physical inventory far apart by the time year-end audits arrive.
Mole•Master’s M-LAS LiDAR scanning replaces those assumptions with measured data. By capturing the full three-dimensional geometry of every bin, silo, or flat storage pile, M-LAS calculates actual volume — not an estimate — giving your team defensible numbers when auditors, lenders, and regulators come asking.
Know What’s In the Bin —
Down to the Bushel.
Grain doesn’t sit in tidy geometric shapes. Cone-ups, cave-ins, bridging, and uneven pile surfaces all distort simple stick-and-tape calculations, and the error compounds across dozens of bins. A single mismeasured bin can throw off a facility’s entire inventory position by thousands of bushels.
With more than 40 years solving material flow and storage challenges in bulk assets, Mole•Master extends that expertise to inventory accuracy. M-LAS LiDAR captures millions of data points across the full surface of stored material, generating a true volumetric model of the pile as it actually sits — not as it’s assumed to sit.
Key Fact
Manual inventory estimates for grain and bulk material commonly carry error margins of several percentage points per bin. Mole•Master’s M-LAS LiDAR calculates volume directly from millions of measured points across the full pile surface, reducing that uncertainty to a fraction of a percent — the difference between a reconciled audit and a flagged one.

Inventory Data Built for the Auditor’s Desk
- Full interior scan of every bin, silo, or flat storage pile using non-entry LiDAR at ±2mm accuracy
- Precise volumetric calculations converted to bushels, tons, or your preferred inventory unit
- Side-by-side comparison of physical (scanned) inventory against book inventory
- Detection of bridging, voids, and uneven pile surfaces that distort manual estimates
- Written PDF inventory reports, and secure offline viewing tools for your finance and operations teams

Impact & Stakeholders
Accurate volumetric data does more than satisfy an audit request — it changes how confidently your organization can plan, borrow, and report.
Audit-Ready Inventory, Every Time
Enter year-end with physical inventory figures your finance team can stand behind — measured, documented, and ready to reconcile against book values without last-minute adjustment.
Reduce Shrinkage & Unexplained Loss
Recurring variances between book and physical inventory often go uninvestigated because there’s no reliable way to measure the physical side. M-LAS gives you a measured baseline to identify where loss is actually occurring.
Stronger Position With Lenders & Insurers
Grain inventory frequently secures financing or insurance coverage. Documented, defensible volumetric data supports collateral valuations and claims with evidence, not estimates.
Confident Reconciliation Across Every Bin
Instead of extrapolating a handful of stick readings across an entire facility, every bin gets its own measured figure — reducing the compounding error that builds up across a multi-bin site.
How M-LAS Data Informs Better Decisions
Finance & Accounting
Enter audit season with measured inventory figures already reconciled against book values, reducing adjustment risk and audit findings.
Operations & Elevator Management
Know actual bin-by-bin volumes to plan intake, rotation, and outbound shipments without relying on assumptions.
Auditors & Compliance
Access a documented, repeatable measurement methodology and full data record supporting inventory valuations.
Capital Planning & Risk Management
Use measured inventory data to support financing agreements, insurance valuations, and collateral reporting with defensible evidence.
The M-LAS Process for Inventory Scanning
1
Pre-Scan Planning
Our team works with your site contacts to identify every bin, silo, or storage pile to be scanned and align the schedule with your audit or reporting timeline.
2
On-Site Data Capture
Using non-entry LiDAR technology, technicians capture millions of data points across each pile surface — no confined space entry required.
3
Volumetric Calculation & Analysis
Captured data is processed into precise volume figures, converted into bushels, tons, or your unit of choice, and compared directly against book inventory.
4
Reporting & Delivery
Your team receives PDF inventory reports, CAD-ready files, and a documented data record ready to support your audit, financing, or regulatory requirements.
See the Difference
Real Results. Real ROI.
Drag the slider to reveal the power of LiDAR analysis.


← Drag to compare →
Proven in the Field
Case Study A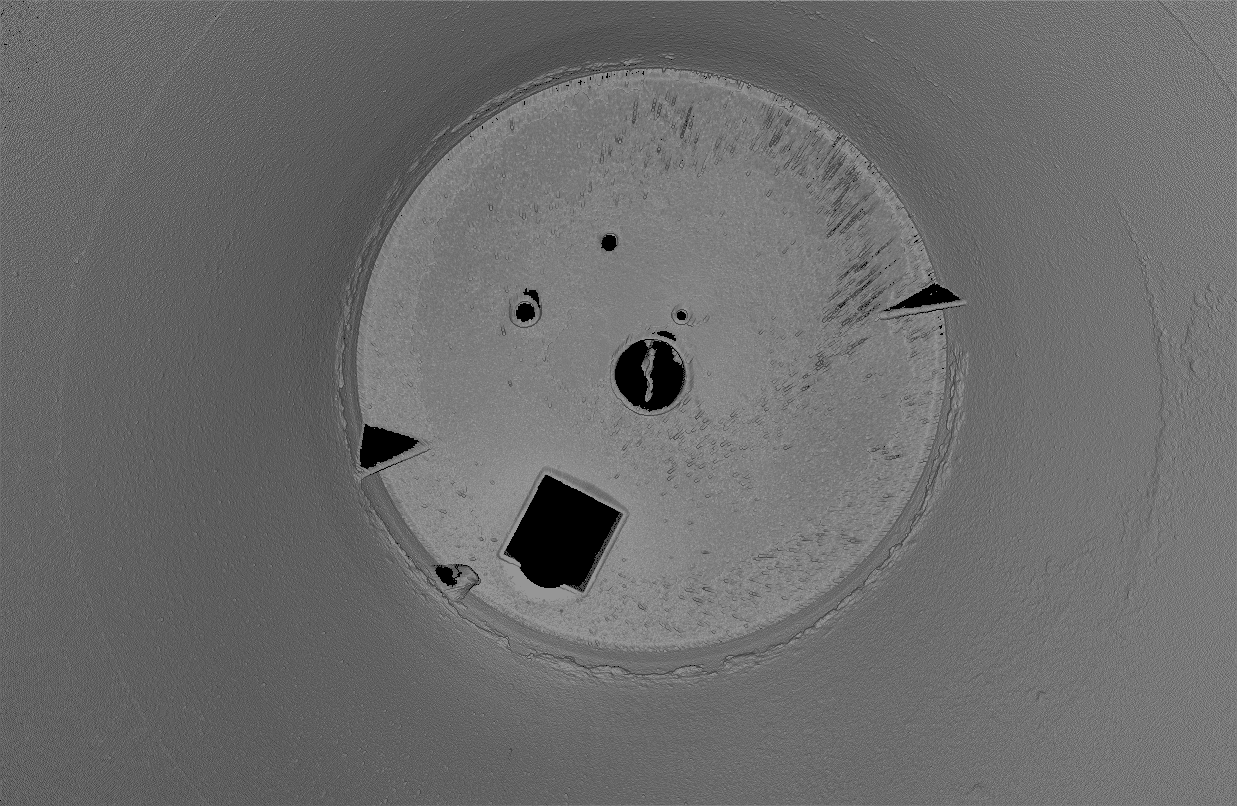

Next-Day Operational Insights
M-LAS scans provided next-day operational insights on a dormant silo—saving the client from unnecessary confined-space entry costs and eliminating safety risks entirely.
Case Study B
Buried Infrastructure Found in Minutes
LiDAR analysis identified ductwork buried in 5ft of material within 30 minutes—allowing immediate course correction and safe project completion.
More Precision in Every Scan


Why It Matters
The M-LAS Advantage
Safety First
- Zero confined space entry, zero incidents
- No permits, testing, or rescue readiness needed
- Proven to eliminate top industrial safety hazards
Operational Excellence
- Prevent outages before they happen
- Optimize maintenance scheduling
- Plan confidently with exact, verified measurements
Financial Performance
- Accurate inventory = better cash flow
- Prevent over-ordering and loss from shrinkage
- Extend asset lifespan and demonstrate safety compliance
Why Industry Leaders Choose M-LAS
MSHA & OSHA-trained technicians. 40+ years in bulk storage. Highest point density and speed in the industry.
Certified Expertise
MSHA & OSHA-trained technicians with full regulatory compliance.
Sector Specialization
40+ years in silo and bulk storage assets across dozens of industries.
Technology Leadership
Highest point density and scanning speed in the industry.
Proven Across Industries
Cement, grain, petrochemical, mining, and power generation.
What You Receive
Deliverables Tailored to Your Team
Operations Teams
- 360° HDR images for complete visual coverage
- Volume data for accurate material tracking
- Annotated findings delivered via secure web portal
- Accessible reports for rapid decision-making
Standard Photo
LiDAR Scan
Click to swap
Engineering Teams
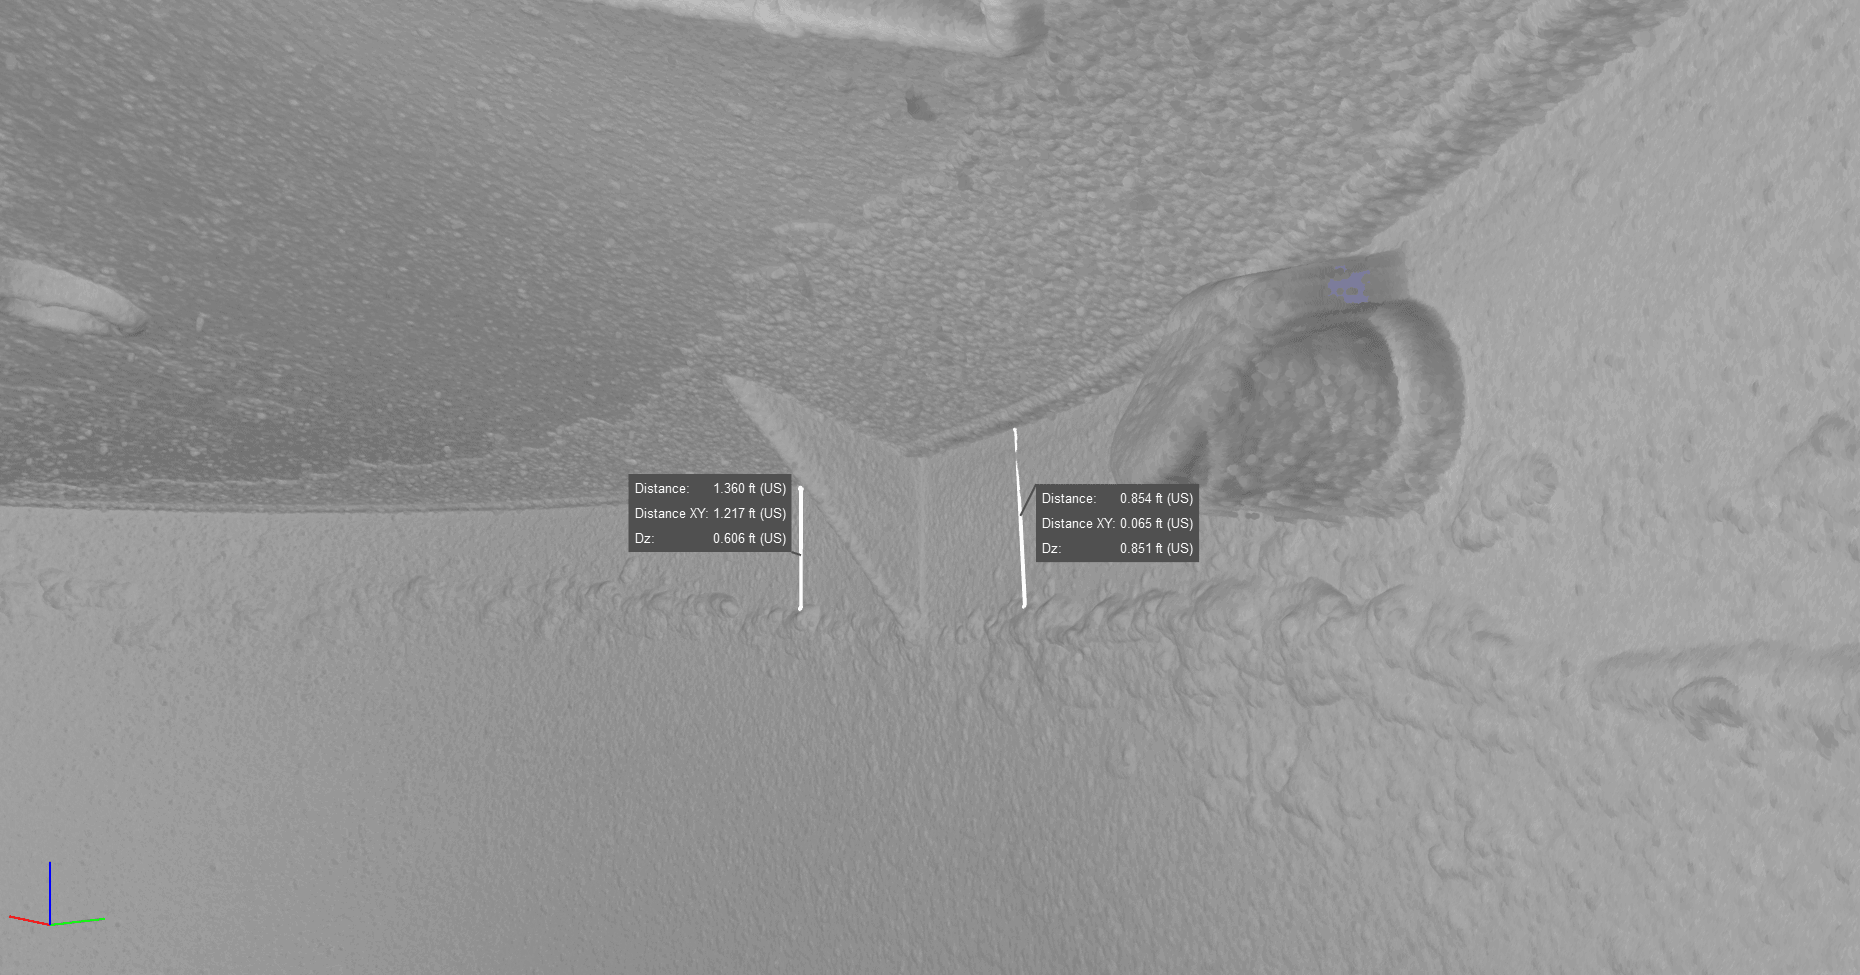
- CAD-compatible 3D models (.las, .e57, .rcp)
- Accurate to ±2mm for precise engineering work
- Detailed point cloud data for structural analysis
- Measurement overlays and cross-sections
Asset Management Teams
- Baseline scans for long-term condition tracking
- Archival reports with full audit trails
- CMMS integration for automated tracking
- Trend analysis across multiple scan periods

Get StartedYour Safer, Smarter Silo
Your Safer, Smarter Silo
Management Starts Today
Three ways to connect:
1
Schedule a Free Consultation
Free discovery call with a LiDAR specialist
2
Request Sample Reports
See deliverables quality firsthand
3
Talk With a Technician
Discuss specific assets, pricing, or customization
↓ Tell us about your project and how you’d like to connect. ↓